|
|
Relative CPU migrations activity
The statistics were last updated Tuesday, 20 October 2026 at 19:36
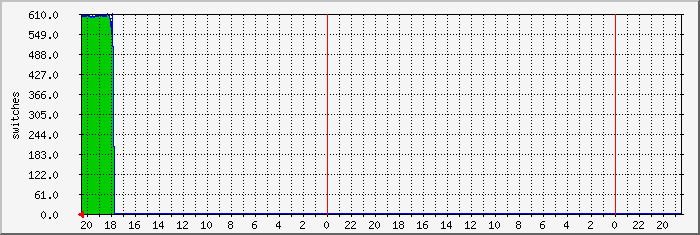
`Daily' Graph (5 Minute Average)
|
Max |
Average |
Current |
| migration_activity: |
607.0 switches |
591.0 switches |
601.0 switches |
| migration_activity: |
607.0 switches |
591.0 switches |
601.0 switches |
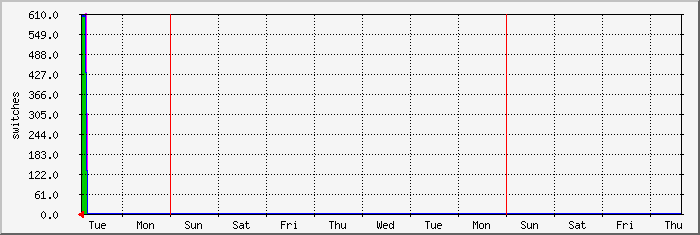
`Weekly' Graph (30 Minute Average)
|
Max |
Average |
Current |
| migration_activity: |
608.0 switches |
488.0 switches |
602.0 switches |
| migration_activity: |
608.0 switches |
488.0 switches |
602.0 switches |
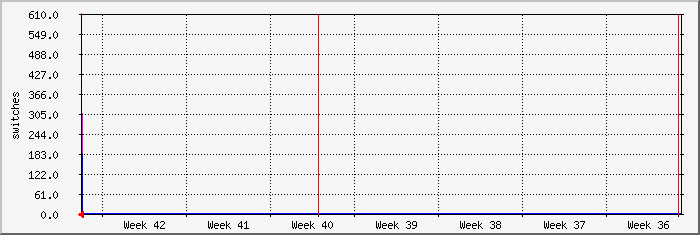
`Monthly' Graph (2 Hour Average)
|
Max |
Average |
Current |
| migration_activity: |
0.0 switches |
0.0 switches |
0.0 switches |
| migration_activity: |
0.0 switches |
0.0 switches |
0.0 switches |
`Yearly' Graph (1 Day Average)
|
Max |
Average |
Current |
| migration_activity: |
0.0 switches |
0.0 switches |
0.0 switches |
| migration_activity: |
0.0 switches |
0.0 switches |
0.0 switches |
| GREEN ### |
Incoming Traffic in Bytes per Second |
| BLUE ### |
Outgoing Traffic in Bytes per Second |
| DARK GREEN ### |
Maximal 5 Minute Incoming Traffic |
| MAGENTA ### |
Maximal 5 Minute Outgoing Traffic |
|


